In March, legal marijuana sales across 21 recreational states and two significant medical-only states—Florida and Oklahoma—totaled more than $2.1 billion.
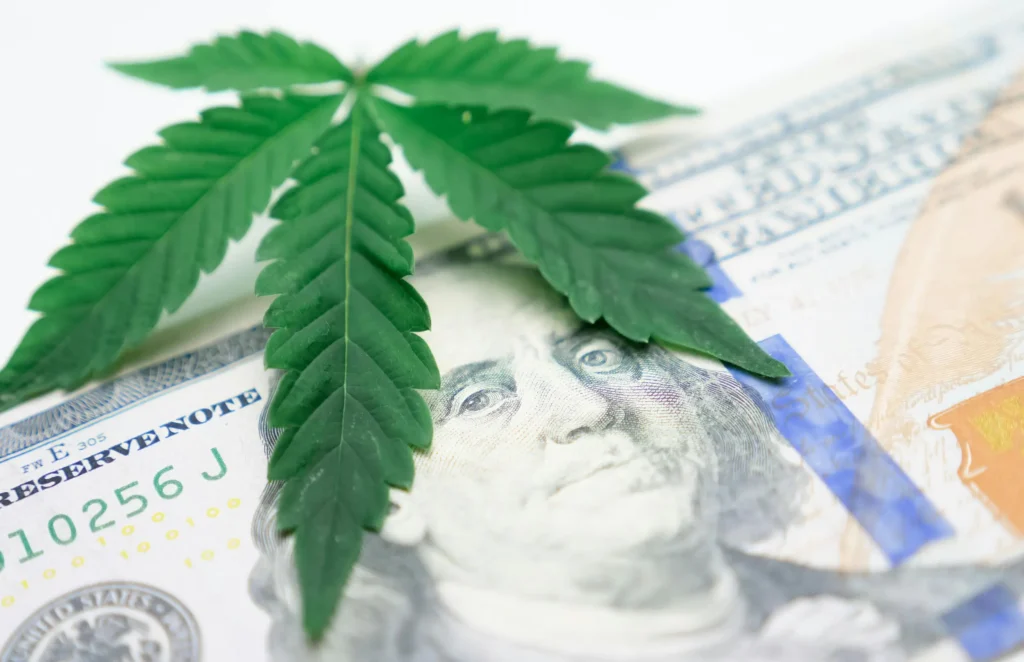
According to data from state regulatory agencies and commission and the research firm Headset, legal marijuana states in the U.S. sold $2.15 billion worth of marijuana and marijuana products in March, a slight increase over the $2.06 billion in January and the $1.97 billion in February. This brings 2025’s total to $6.18 billion.
The list below excludes Delaware and Minnesota, both of which have legalized recreational marijuana but have not yet launched their markets, and Virginia, which has legalized marijuana possession but not commercial sales. Alaska is also omitted due to the lack of reliable sales data for March. Oklahoma and Florida are the only medical-only states included, as no other medical state had sales data available for March.
National Cannabis Sales – March 2025
| State | Total Sales (USD) | Year Legalized |
|---|---|---|
| California | $316.5M | 2016 |
| Michigan | $276.9M | 2018 |
| Florida | $162.0M | 2016 |
| Illinois | $150.0M | 2019 |
| Massachusetts | $135.0M | 2016 |
| Missouri | $130.0M | 2022 |
| New York | $109.4M | 2021 |
| Arizona | $100.0M | 2020 |
| Colorado | $99.1M | 2012 |
| New Jersey | $98M | 2020 |
| Maryland | $96.4M | 2022 |
| Washington | $92.2M | 2012 |
| Ohio | $85M | 2023 |
| Oregon | $78M | 2014 |
| Nevada | $54.0M | 2016 |
| Oklahoma | $50.0M | 2018 |
| New Mexico | $50.0M | 2021 |
| Montana | $25.0M | 2020 |
| Connecticut | $24.2M | 2021 |
| Maine | $19.5M | 2016 |
| Rhode Island | $9.75M | 2022 |
| Vermont | $11.0M | 2018 |