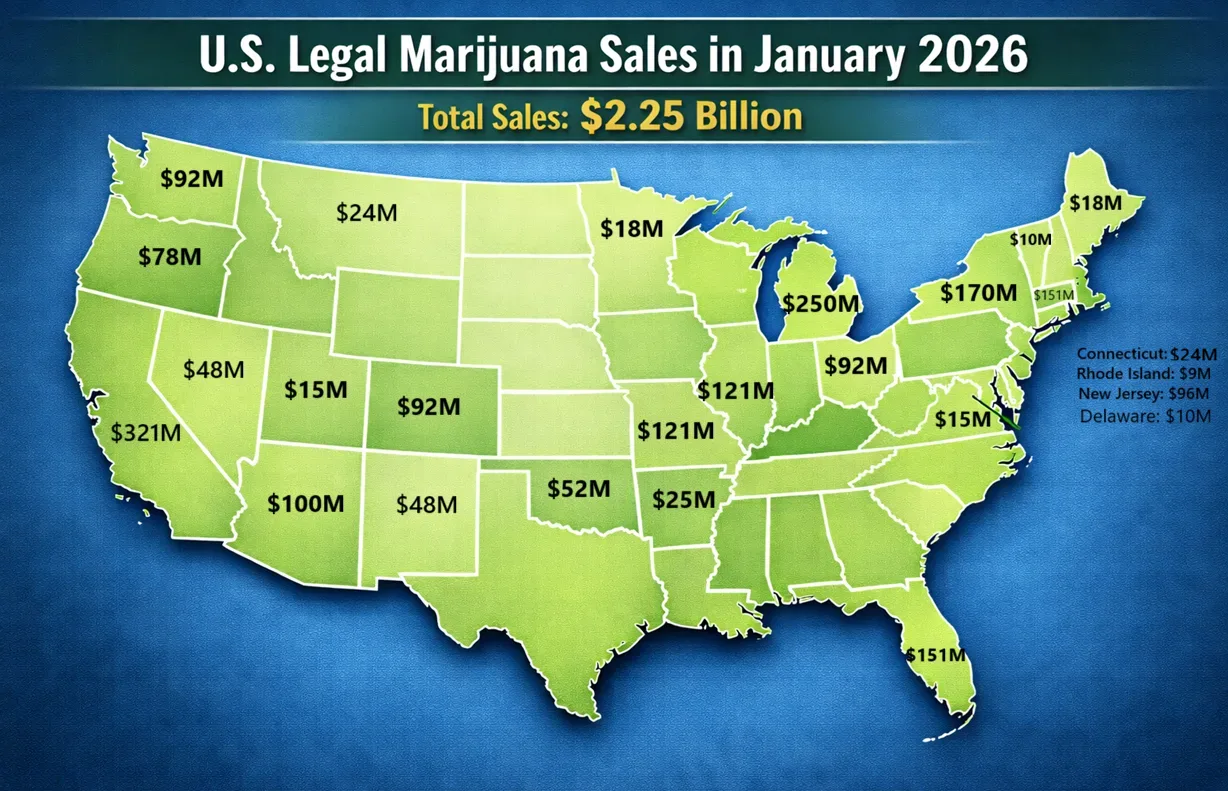
According to an analysis of state sales data conducted by The Marijuana Herald, legal marijuana sales across the U.S. reached $2.25 billion last month, an increase of over 10% from January 2025.
The January total reflects continued growth across both adult-use and medical markets, with year-over-year sales increasing despite ongoing price compression in several mature states. The figures are based on monthly reports released by state marijuana regulatory agencies and commissions, along with supplemental market data from the research firm Headset when necessary.
The analysis covers 23 states with active adult-use marijuana markets, in addition to five of the largest medical-only states. This is the first monthly breakdown in which Minnesota is included.
Below is a state-by-state breakdown of January’s legal marijuana sales.
| State | Total Sales (USD, M=Million) | Year Legalized |
|---|---|---|
| Arkansas* | $25M | 2016 |
| Arizona | $100M | 2020 |
| California | $320M | 2016 |
| Colorado | $92M | 2012 |
| Connecticut | $24M | 2021 |
| Delaware | $10M | 2025 |
| Florida* | $151M | 2016 |
| Illinois | $121M | 2019 |
| Maine | $18M | 2016 |
| Maryland | $97M | 2022 |
| Massachusetts | $151M | 2016 |
| Michigan | $250M | 2018 |
| Minnesota | $19M | 2023 |
| Missouri | $121M | 2022 |
| Montana | $24M | 2020 |
| Nevada | $48M | 2016 |
| New Jersey | $96M | 2020 |
| New Mexico | $48M | 2021 |
| New York | $170M | 2021 |
| Ohio | $92M | 2023 |
| Oklahoma* | $52M | 2018 |
| Oregon | $78M | 2014 |
| Rhode Island | $9M | 2022 |
| Utah* | $16M | 2020 |
| Virginia* | $15M | 2018 |
| Vermont | $10M | 2018 |
| Washington | $92M | 2012 |
*Medical-only states.
Sponsors: