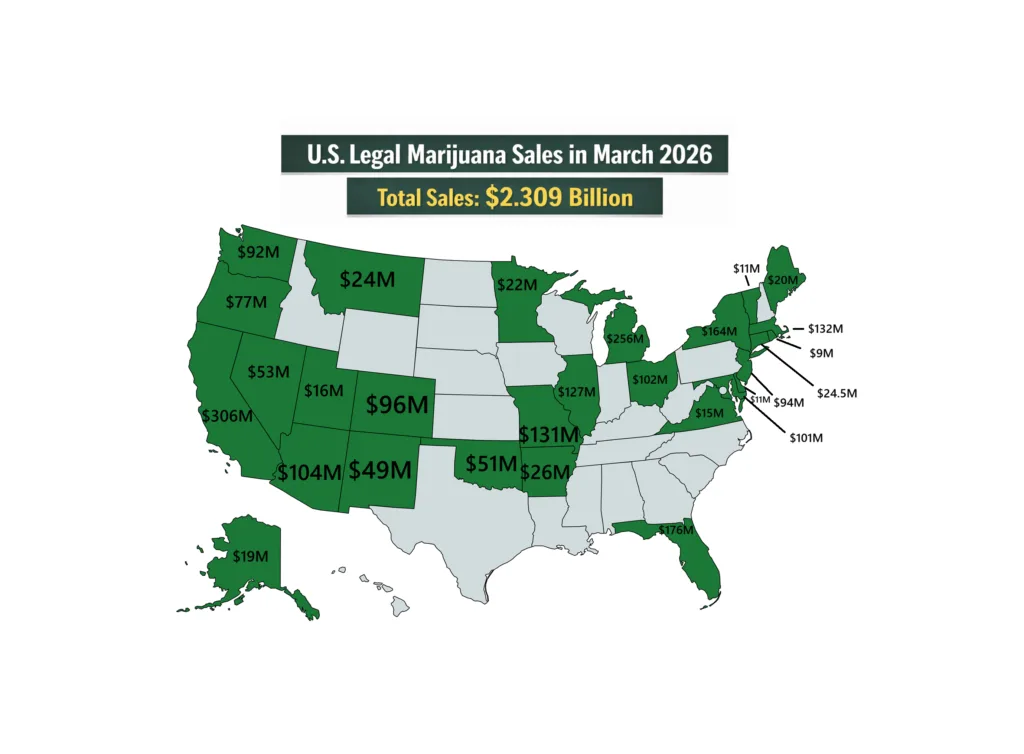
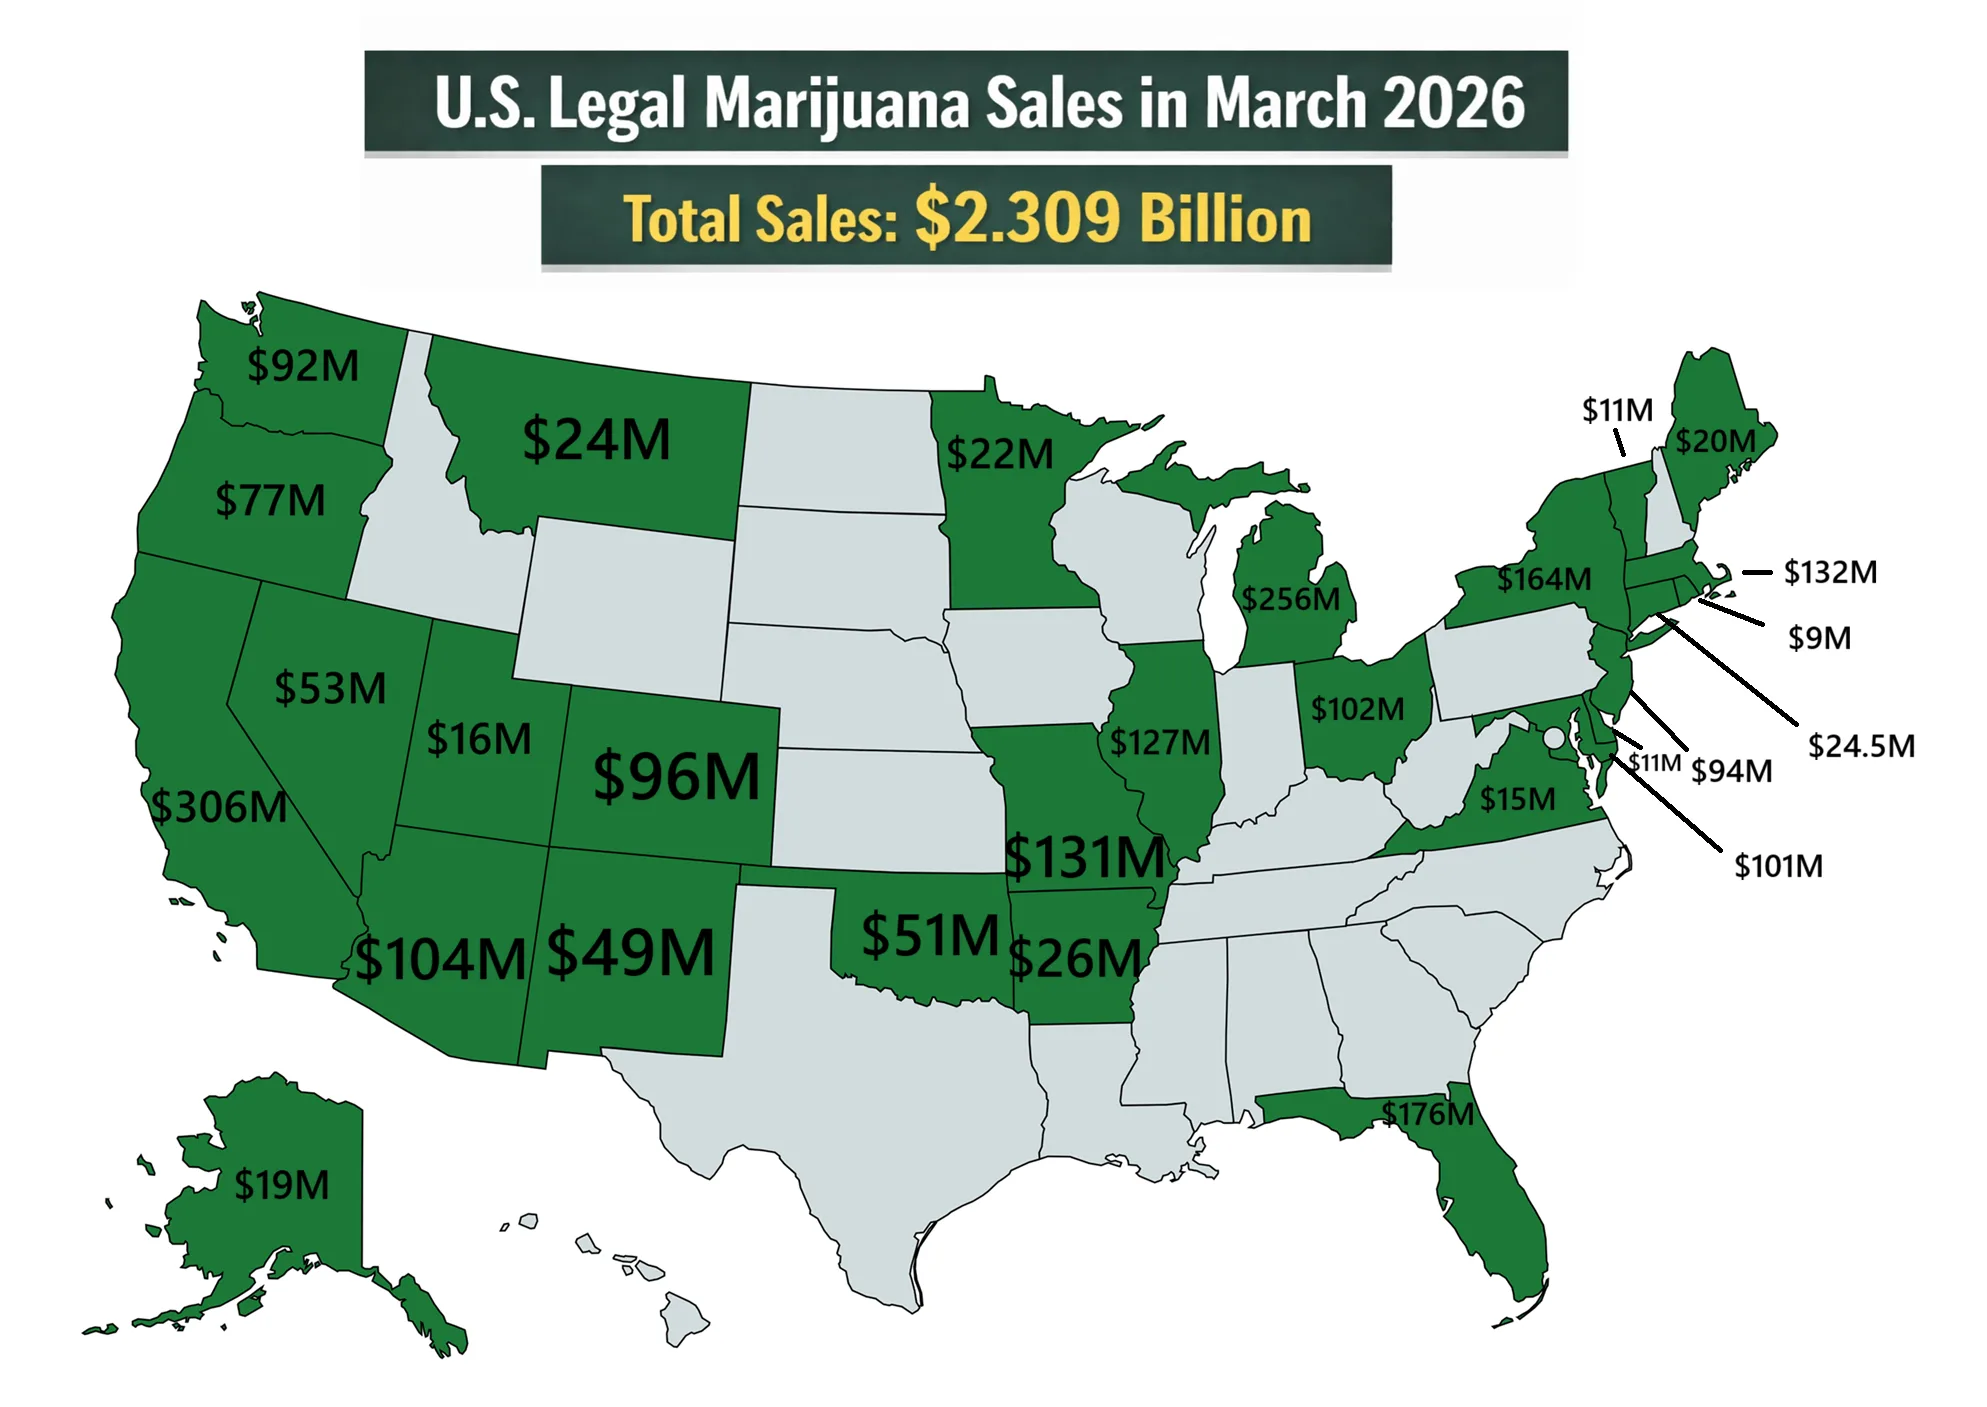
Legal cannabis markets in the United States generated over $2.3 billion in total sales in March, and nearly $6.6 billion for the first quarter of the year.
This is according to an analysis by The Marijuana Herald of state-level cannabis sales figures. The data was provided by state regulatory agencies, and when that wasn’t possible by the research firm Headset. The analysis includes 23 states with legal adult-use sales, along with five of the nation’s largest medical-only marijuana markets.
Here’s the full state-by-state breakdown for March.
| State | Total Sales (USD, M=Million) | Year Legalized |
|---|---|---|
| Arkansas* | $26M | 2016 |
| Arizona | $104M | 2020 |
| Alaska | $19M | 2014 |
| California | $306M | 2016 |
| Colorado | $96M | 2012 |
| Connecticut | $24.5M | 2021 |
| Delaware | $11M | 2025 |
| Florida* | $176M | 2016 |
| Illinois | $127M | 2019 |
| Maine | $20M | 2016 |
| Maryland | $101M | 2022 |
| Massachusetts | $132M | 2016 |
| Michigan | $256M | 2018 |
| Minnesota | $22M | 2023 |
| Missouri | $131M | 2022 |
| Montana | $24M | 2020 |
| Nevada | $53M | 2016 |
| New Jersey | $94M | 2020 |
| New Mexico | $49M | 2021 |
| New York | $164M | 2021 |
| Ohio | $102M | 2023 |
| Oklahoma* | $51M | 2018 |
| Oregon | $77M | 2014 |
| Rhode Island | $9M | 2022 |
| Utah* | $16M | 2020 |
| Virginia* | $15M | 2018 |
| Vermont | $11M | 2018 |
| Washington | $92M | 2012 |
*Medical-only states.