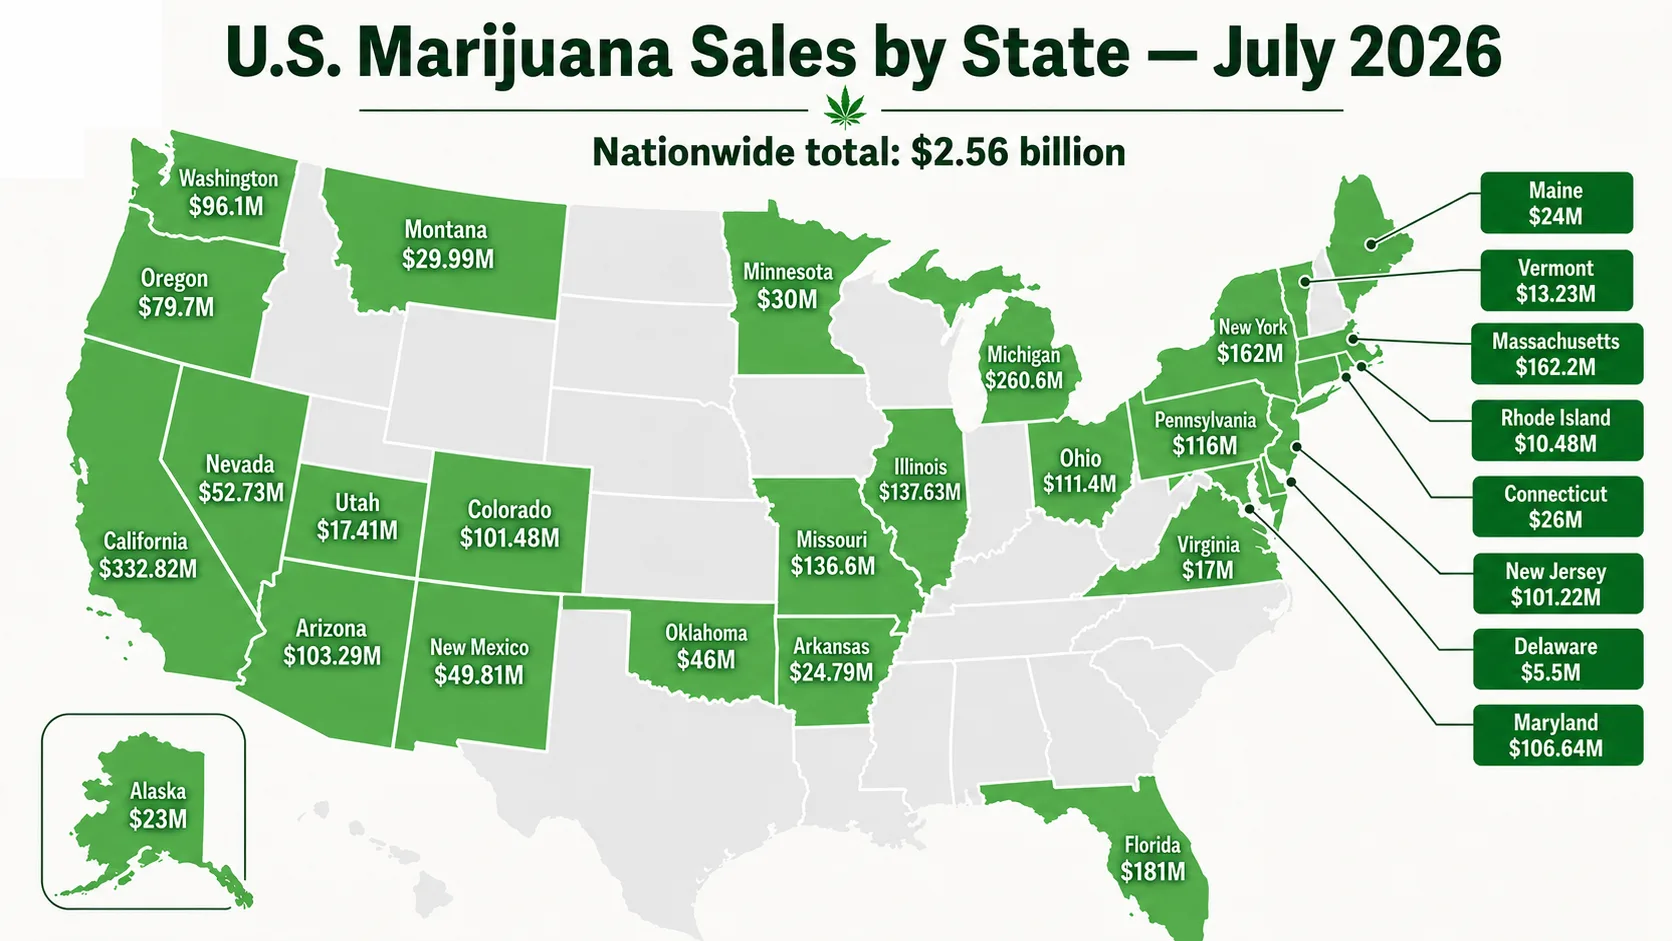
Legal marijuana sales across the United States reached approximately $2.56 billion in July, bringing the nationwide total for the first seven months of 2026 to roughly $16.6 billion, according to an analysis of state sales data compiled by The Marijuana Herald.
July sales increased from the approximately $2.47 billion generated in June, with several of the nation’s largest marijuana markets experiencing notable month-over-month growth. The $2.56 billion is the highest monthly total tracked by The Marijuana Herald and marks a 10% increase from July 2025, although it’s worth noting that Minnesota and Delaware didn’t have active markets at the time.
California remained by far the country’s largest legal marijuana market, generating approximately $332.8 million in July, followed by Michigan at $260.6 million. Massachusetts and New York each surpassed $160 million, while Illinois and Missouri both topped $135 million.
Several smaller markets also reported notable July totals. Montana generated $29,992,180, the second-highest monthly amount in state history, while New Mexico retailers reported $49.81 million in combined recreational and medical marijuana purchases. Oregon sales reached approximately $79.7 million, the state’s strongest month since August 2025.
Based on an analysis of figures provided by state regulatory agencies and the cannabis research firm Headset, below is a full breakdown of legal marijuana sales in July, listed alphabetically by state. The list includes every state with an operating recreational cannabis market, as well as five of the largest medical-only markets.
| State | Total Sales (USD, M=Million) | Year Legalized |
|---|---|---|
| Arkansas* | $24.79M | 2016 |
| Arizona | $103.29M | 2020 |
| Alaska+ | $23M | 2014 |
| California | $332.82M | 2016 |
| Colorado | $101.48M | 2012 |
| Connecticut | $26M | 2021 |
| Delaware+ | $5.5M | 2025 |
| Florida* | $181M | 2016 |
| Illinois | $137.63M | 2019 |
| Maine | $24M | 2016 |
| Maryland | $106.64M | 2022 |
| Massachusetts | $162.2M | 2016 |
| Michigan | $260.6M | 2018 |
| Minnesota | $30M | 2023 |
| Missouri | $136.6M | 2022 |
| Montana | $29.99M | 2020 |
| Nevada | $52.73M | 2016 |
| New Jersey | $101.22M | 2020 |
| New Mexico | $49.81M | 2021 |
| New York | $162M | 2021 |
| Ohio | $111.4M | 2023 |
| Oklahoma* | $46M | 2018 |
| Oregon | $79.7M | 2014 |
| Pennsylvania* | $116M | 2014 |
| Rhode Island | $10.48M | 2022 |
| Utah* | $17.41M | 2020 |
| Virginia* | $17M | 2018 |
| Vermont | $13.23M | 2018 |
| Washington | $96.1M | 2012 |
*Medical-only states.
+Data for Alaska and Delaware is based on estimates, as sales figures were unavailable from either state’s cannabis commission or Headset.