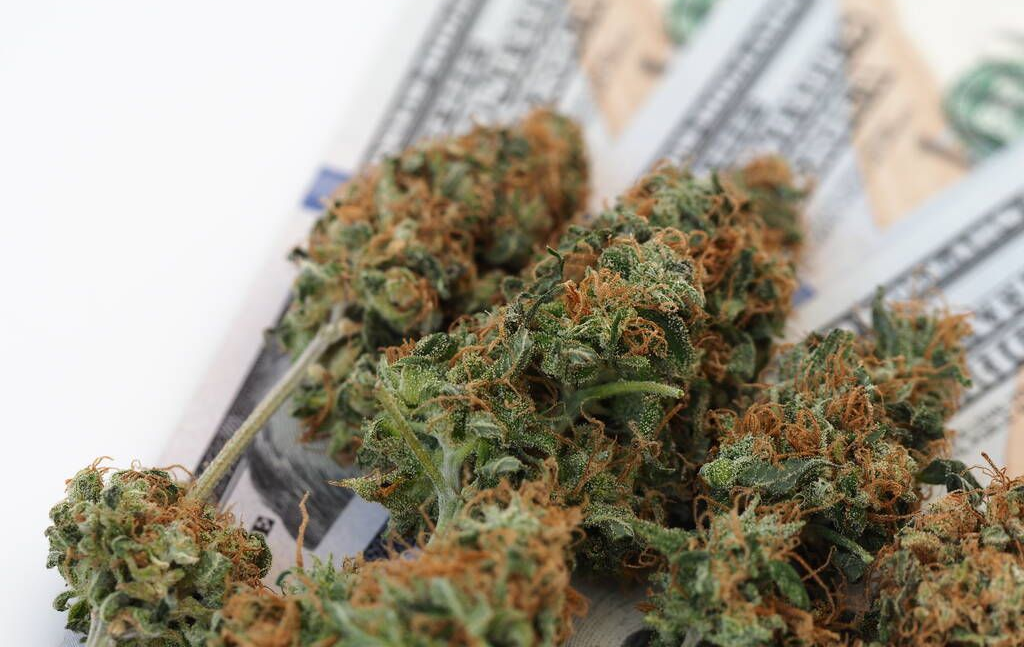
Legal marijuana sales across the U.S. reached approximately $2.48 billion in May, bringing the nationwide total for 2026 to around $11.5 billion through the first five months of the year. May’s total follows $2.34 billion in April, $2.3 billion in March, $2.12 billion in February and $2.25 billion in January.
The Marijuana Herald reviewed monthly sales data from state regulatory agencies, using figures from the research firm Headset in markets where official monthly totals were not available. The analysis covers 23 adult-use states and six of the nation’s largest medical-only marijuana markets.
Below is the full May breakdown by state.
| State | Total Sales (USD, M=Million) | Year Legalized |
|---|---|---|
| Arkansas* | $25M | 2016 |
| Arizona | $101M | 2020 |
| Alaska | $20M | 2014 |
| California | $310M | 2016 |
| Colorado | $100M | 2012 |
| Connecticut | $25M | 2021 |
| Delaware | $11M | 2025 |
| Florida* | $185M | 2016 |
| Illinois | $130M | 2019 |
| Maine | $20M | 2016 |
| Maryland | $102M | 2022 |
| Massachusetts | $150M | 2016 |
| Michigan | $258M | 2018 |
| Minnesota | $26M | 2023 |
| Missouri | $135M | 2022 |
| Montana | $25M | 2020 |
| Nevada | $52M | 2016 |
| New Jersey | $100M | 2020 |
| New Mexico | $48M | 2021 |
| New York | $165M | 2021 |
| Ohio | $107M | 2023 |
| Oklahoma* | $46M | 2018 |
| Oregon | $78M | 2014 |
| Pennsylvania* | $115M | 2014 |
| Rhode Island | $11M | 2022 |
| Utah* | $15M | 2020 |
| Virginia* | $16M | 2018 |
| Vermont | $11M | 2018 |
| Washington | $89M | 2012 |
*Medical-only states.