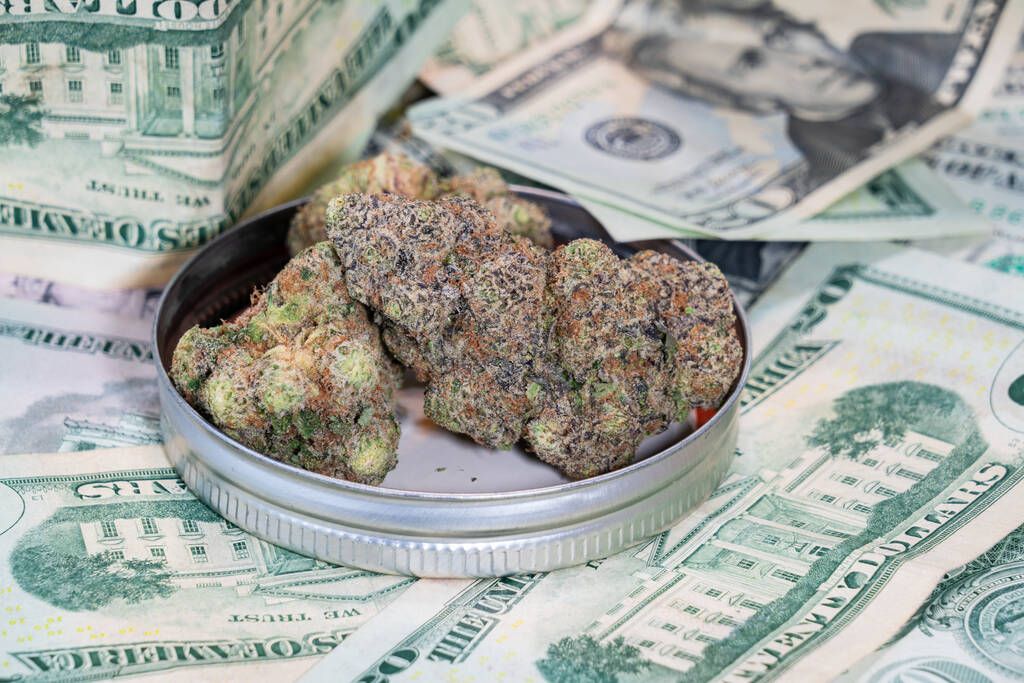
August produced approximately $2.55 billion in legal marijuana sales across the United States, keeping the nationwide market near July’s record pace and bringing sales for the first eight months of 2026 to roughly $19.1 billion, according to an analysis by The Marijuana Herald.
The August total was down slightly from the approximately $2.56 billion generated in July, a difference of less than 0.5%. However, sales were around 12% higher than in August 2025, when sales totaled $2.27 billion.
California remained by far the country’s largest legal marijuana market, generating approximately $326.3 million in August. Michigan followed with $263.5 million, while New York reached $165.8 million. Massachusetts, Missouri and Illinois each generated more than $135 million during the month.

The figures below were compiled using data from state regulatory agencies and cannabis research firm Headset. In states where complete August retail sales figures were not yet available, The Marijuana Herald calculated estimates using recent monthly totals, official sales trends and other available market data.
The list includes all 23 states with operating recreational marijuana markets, along with six of the largest medical-only markets.
| State | Total Sales (USD, M=Million) | Year Legalized |
|---|---|---|
| Alaska‡ | $23M | 2014 |
| Arizona | $100.3M | 2020 |
| Arkansas† | $25M | 2016 |
| California | $326.31M | 2016 |
| Colorado | $99.68M | 2012 |
| Connecticut | $25.23M | 2021 |
| Delaware‡ | $7.95M | 2023 |
| Florida† | $190M | 2016 |
| Illinois | $136.73M | 2019 |
| Maine | $24.5M | 2016 |
| Maryland | $106.44M | 2022 |
| Massachusetts | $145.11M | 2016 |
| Michigan | $263.48M | 2018 |
| Minnesota | $29M | 2023 |
| Missouri | $137.24M | 2022 |
| Montana | $29.20M | 2020 |
| Nevada | $51.06M | 2016 |
| New Jersey | $100.92M | 2020 |
| New Mexico | $49.5M | 2021 |
| New York | $165.76M | 2021 |
| Ohio | $110.3M | 2023 |
| Oklahoma† | $52.82M | 2018 |
| Oregon | $77.62M | 2014 |
| Pennsylvania†‡ | $116M | 2016 |
| Rhode Island | $10.7M | 2022 |
| Utah† | $17M | 2018 |
| Vermont | $13.5M | 2018 |
| Virginia† | $17M | 2018 |
| Washington | $95.98M | 2012 |
†Medical-only state.
‡Estimate based on the most recent available state data, recent monthly sales trends and other available market information.